
Response time is a primary, controllable driver of perceived service quality. Reduce your first response time and you immediately protect CSAT, retention, and conversion. The SERVQUAL framework names responsiveness as one of five core dimensions of service quality, and industry data shows that sub-5-minute replies correlate with roughly 92% CSAT while 24-hour replies drop toward 51%.
Three things to act on right now:
- Acknowledge immediately. Send a templated acknowledgment within 2 minutes of any inbound request, even before a technician or agent is assigned.
- Set channel SLA targets today. Live chat: under 1 minute. Email: under 1 hour for priority requests. Phone: under 20 seconds average speed to answer.
- Run one measurement this week. Pull your First Response Time (FRT) by channel for the past 30 days and compare it against the benchmarks in this article.
Key Takeaways
Response time is the single most controllable driver of perceived service quality, and the gap between a sub-5-minute reply and a 24-hour reply represents a 41-percentage-point difference in CSAT.
| Point | Details |
|---|---|
| Response time drives CSAT directly | Sub-5-minute replies correlate with roughly 92% CSAT; 24-hour replies drop toward 51%. |
| SERVQUAL names responsiveness as core | Promptness, availability, and willingness to help are formal service-quality dimensions, not soft skills. |
| Pair FRT with re-contact rate | Fast first replies that generate callbacks are a quality failure, not a success. |
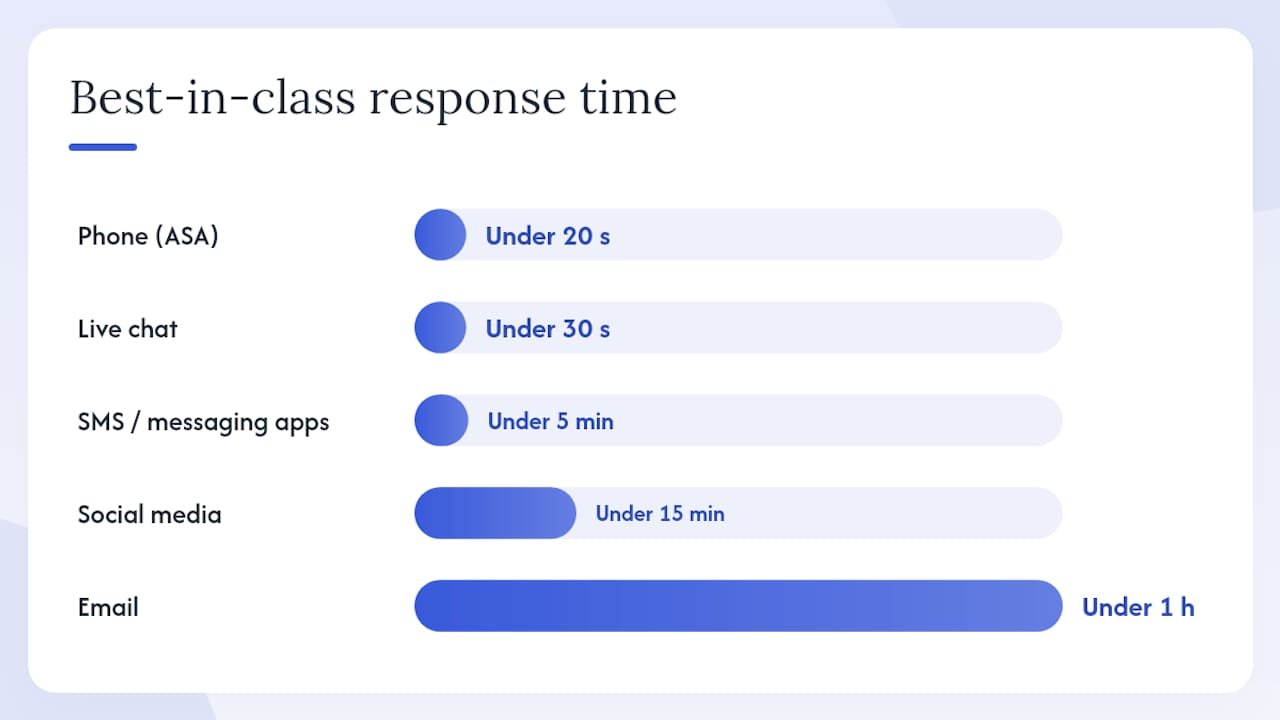
| Channel benchmarks differ significantly | Live chat targets under 30 seconds; email best-in-class is under 1 hour; phone ASA should stay under 20 seconds. |
| Mdtechservices | Provides structured acknowledgment, licensed dispatch, and SLA-driven response for appliance, HVAC, and plumbing requests in Orange and Los Angeles County. |
Table of Contents
- Why response time is a core pillar of service quality
- How response time affects customer satisfaction and business outcomes
- Which response-time metrics actually matter
- What are the right response-time benchmarks by channel?
- How to reduce response time: people, process, and technology
- When speed can hurt service quality and how to guard against it
- How to measure the business impact of faster response times
- A field example: improving responsiveness in a home-services operation
- Manager’s one-week to three-month implementation checklist
- Why responsiveness is a priority at Mdtechservices
- Mdtechservices delivers the responsive local service your property deserves
- Sources
Why response time is a core pillar of service quality
Responsiveness is not just a courtesy metric. Within the SERVQUAL model, it represents a customer’s perception of your willingness to help promptly, your availability, and your proactive communication. Those three elements combine to form one of the strongest predictors of overall service satisfaction.
The behavioral mechanism behind this is well documented. When a customer contacts a service provider, the speed and structure of the initial reply functions as a cognitive shortcut. Customers infer reliability and competence from a prompt, well-organized first reply, even before the underlying problem is resolved. A slow first response signals indifference, regardless of how thorough the eventual fix turns out to be.
Academic research using the SERVQUAL model confirms that responsiveness significantly predicts customer satisfaction across service categories, including field services like auto care and home repair. The study found high path coefficients linking responsiveness directly to satisfaction scores, reinforcing what most experienced service managers already sense: speed influences perception before resolution does.
For managers, the practical implication is clear:
- First impressions are set by speed, not by outcome. A customer who waits 4 hours for an acknowledgment has already formed a negative impression, even if the repair is completed perfectly.
- Responsiveness signals respect. Customers read a fast reply as evidence that their request matters.
- Proactive communication reduces anxiety. An ETA update sent before the customer asks is worth more than a perfect resolution delivered in silence.
How response time affects customer satisfaction and business outcomes
The relationship between response speed and customer satisfaction is close to linear. Industry analysis shows that each hour of delay reduces CSAT measurably, and the effect compounds quickly. The numbers are stark:
- Sub-5-minute reply: approximately 92% CSAT
- 1-hour reply: approximately 78% CSAT
- 24-hour reply: approximately 51% CSAT
- 48+ hour reply: approximately 23% CSAT
Those are not marginal differences. Moving from a 24-hour reply to a sub-5-minute reply represents a 41-percentage-point CSAT swing. For a service operation handling hundreds of requests per month, that gap translates directly into reviews, referrals, and repeat business.
The conversion effect is equally significant. Research published in the Harvard Business Review on online sales lead response found that leads contacted within 5 minutes were dramatically more likely to convert than those reached after 30 minutes. In field services, where a homeowner with a broken refrigerator or a failed HVAC unit is likely contacting two or three providers simultaneously, the first company to respond with a clear, confident reply typically wins the job.
Retention follows the same pattern. Customers who experience slow responses are more likely to switch providers at the next opportunity, even when the eventual service quality is acceptable. The slow response becomes the lasting memory. SLA attainment data shows that teams consistently meeting response SLAs report substantially higher CSAT than those that miss them, and that each hour of delayed first response can reduce CSAT by double-digit percentage points in high-expectation service categories.
Pro Tip: Track CSAT separately for requests that received a first response within your SLA target versus those that missed it. The gap between those two cohorts is your clearest argument for investing in faster response.
Which response-time metrics actually matter
Tracking response time well requires more than pulling a single average. Here are the six metrics that give you a complete picture:
- First Response Time (FRT): The elapsed time from when a customer submits a request to when they receive the first substantive reply. This is the most cited metric and the one customers feel most directly.
- Average Speed to Answer (ASA): Specific to voice channels; the average time a caller waits before reaching a live agent. ASA data shows that every 10-second increase in ASA links to roughly a 1.8–2.4% rise in call abandonment, and CSAT drops steeply after 60–120 seconds of hold time.
- Time to Resolution (TTR): The total elapsed time from first contact to confirmed resolution. TTR matters for complexity tracking and for identifying cases where fast FRT masked a slow fix.
- SLA compliance rate: The percentage of requests handled within your defined response and resolution windows. This is your operational health signal.
- Re-contact rate: The percentage of customers who contact you again within a defined window (typically 7 days) about the same issue. A low FRT paired with a high re-contact rate is a false positive — you replied fast but did not resolve the problem.
- Initial acknowledgment time: Distinct from FRT when your workflow separates an automated acknowledgment from a substantive human reply. Track both, and never let an auto-reply mask a slow human response.
Pairing FRT with re-contact rate is the single most important measurement discipline in this space. Fast first replies that generate callbacks are not a win; they are a quality problem wearing a speed costume.
Common measurement pitfalls to avoid:
| Pitfall | Why it distorts your data | Fix |
|---|---|---|
| Mixing channels in one FRT average | Chat and email have different expectations; blending them hides channel-level problems | Report FRT separately by channel |
| Counting auto-replies as FRT | Inflates apparent speed; customers do not experience a bot acknowledgment as a real response | Separate automated and human FRT in your dashboard |
| Tracking FRT without TTR | Fast replies can mask slow resolutions | Always report both metrics side by side |
| Ignoring re-contact rate | High re-contact signals incomplete first resolution | Add re-contact rate as a mandatory dashboard column |
What are the right response-time benchmarks by channel?
Benchmarks vary by channel, and using the wrong target for the wrong channel is a common planning mistake. Cross-channel first-response data shows that industry averages consistently lag behind customer expectations, which means hitting the average is not enough.
| Channel | Best-in-class | Acceptable | At-risk |
|---|---|---|---|
| Live chat | Under 30 seconds | Under 1 minute | Over 2 minutes |
| Phone (ASA) | Under 20 seconds | Under 60 seconds | Over 2 minutes |
| Under 1 hour | Under 4 hours | Over 8 hours | |
| Social media | Under 15 minutes | Under 1 hour | Over 4 hours |
| SMS / messaging apps | Under 5 minutes | Under 30 minutes | Over 2 hours |
Zendesk’s first-reply guidance reinforces that live chat customers expect sub-1-minute responses, while email expectations are measured in hours. Social media sits between those poles, with platforms like X (formerly Twitter) driving expectations toward 15–30 minutes.
Priority-tier SLA examples add another layer. A P1 (critical, service-down) request should target a first response within 15–30 minutes regardless of channel. P2 (high impact) typically targets 1–2 hours. P3 (standard) sits at 4–8 hours, and P4 (low priority or informational) can extend to 24 hours. Enterprise contracts often compress these windows further, with P1 targets as tight as 5–10 minutes.
Pro Tip: Segment your benchmarks by customer tier, not just by channel. A property manager with 20 active service requests deserves a tighter SLA than a one-time inquiry. Build that segmentation into your triage rules before you publish your SLA targets.
Industry and segment caveats matter too. A home-services provider in a competitive metro market like Los Angeles faces higher customer expectations than a rural provider. Customers who have experienced fast responses from other providers in your category will calibrate their expectations accordingly.
How to reduce response time: people, process, and technology
Improving response time is a three-layer problem. You need the right staffing, the right process, and the right tools working together.
People and scheduling
- Map your inbound volume by hour and day. Most service operations have predictable peaks. Staff to those peaks, not to daily averages.
- Set occupancy targets below 85%. Contact-center staffing models based on Erlang C show that average occupancy above 85% causes ASA to spike nonlinearly. Keep agents at 80–85% occupancy to maintain response speed.
- Train agents on quick acknowledgment. A well-structured 2-sentence acknowledgment sent in 90 seconds is more valuable than a perfect reply sent in 20 minutes. Train for the former.
- Use intraday staffing adjustments. Monitor real-time queue depth and shift agents from lower-priority tasks when volume spikes.
Process changes
- Build a triage protocol. Classify every inbound request by priority (P1–P4) within the first 60 seconds of receipt, and route accordingly.
- Create priority queues. High-value customers and safety-critical requests should bypass standard queues entirely.
- Implement proactive status updates. Send an ETA confirmation within 5 minutes of booking and a reminder 30 minutes before arrival. Customers who know what to expect stop calling to check.
- Use callback management for voice. Offer a callback option when ASA exceeds your target. Most customers prefer a guaranteed callback to an indefinite hold.
For property managers specifically, tenant communication strategies that include templated acknowledgment messages and appointment confirmations reduce inbound follow-up calls by a measurable margin.
Technology
- AI acknowledgments for first touch. Use an AI-driven auto-response that confirms receipt, provides a reference number, and gives an expected response window. This buys your team time without leaving the customer in silence.
- Intelligent routing. Route requests to the right agent or technician on first contact. Misrouted requests add minutes or hours to FRT.
- Self-service and deflection. Mature virtual agent deployments can deflect roughly 28–38% of inbound volume, reducing live-agent queue depth and improving ASA for the requests that do reach a human.
- Workforce management (WFM) software. Tools like NICE WFM or Verint schedule agents against forecast volume, reducing both overstaffing costs and understaffing-driven ASA spikes.
Implementation sequence
- Week 1: Deploy acknowledgment templates, set channel SLA targets, and pull baseline FRT by channel.
- Month 1: Implement triage rules and priority queues, add re-contact rate to your dashboard, and begin intraday staffing adjustments.
- Quarter 1: Pilot AI acknowledgment and routing, roll out WFM scheduling, and run your first A/B test on FRT impact (see the measurement section below).
Pro Tip: Use AI for the first touch and humans for resolution. An AI acknowledgment sent in 10 seconds preserves the customer’s first impression while freeing your team to focus on quality answers rather than racing to reply.
When speed can hurt service quality and how to guard against it
Speed without quality creates a specific failure mode: fast first replies that generate callbacks, complaints, and re-work. Managers who optimize for FRT alone often discover that their re-contact rate climbs in parallel.
Common risks of over-indexing on speed:
- Superficial replies. Agents under pressure to hit FRT targets send incomplete answers that require follow-up, increasing total contact volume.
- SLA gaming. Teams learn to send a quick acknowledgment that technically meets the SLA clock but does not advance resolution. The metric looks good; the customer experience does not.
- Higher re-contact rates. A fast but incomplete first reply generates a second contact, which costs more than a slightly slower but complete first reply.
- Agent burnout. Sustained pressure to respond faster without adequate staffing increases error rates and turnover.
Quality guardrails to put in place:
- Require minimum content standards for first replies (a reference number, a clear next step, and an ETA).
- Measure First Contact Resolution (FCR) alongside FRT. FCR is the percentage of issues resolved without a follow-up contact.
- Route complex technical requests to specialists rather than the first available agent.
- Review cases where re-contact occurred within 24 hours of a fast FRT. These are your quality failure signals.
For safety-critical work — HVAC failures in extreme heat, gas appliance issues, or plumbing emergencies — accuracy takes priority over speed. A fast but incorrect diagnosis on a gas line is worse than a 30-minute delay to get the right technician on-site. Timely HVAC repair matters precisely because the stakes are high, which means the response needs to be both fast and correct.
How to measure the business impact of faster response times
A structured measurement plan turns response-time improvements from a hypothesis into a documented business case.
Experiment design checklist:
- Define the treatment. A specific FRT reduction target (for example, from 4 hours to 1 hour for email) applied to a defined cohort or channel.
- Set a control group. Either a historical baseline (pre-change period) or a concurrent cohort receiving the current response time.
- Choose a measurement window. Run the experiment for at least 30 days to capture enough volume; 60–90 days is better for churn and NPS effects.
- Randomize where possible. For digital channels, randomly assign incoming requests to treatment and control groups to reduce selection bias.
- Document confounders. Seasonal volume changes, staffing changes, and product changes can all affect CSAT independently of response time.
KPIs to monitor:
- CSAT score (post-interaction survey, 1–5 or 1–10 scale)
- Net Promoter Score (NPS), measured at 30 and 90 days post-interaction
- Re-contact rate within 7 days
- SLA attainment rate
- Lead conversion rate (for inbound sales requests)
- Churn rate at 30, 60, and 90 days
The lag effect is real and often underestimated. CSAT responds quickly (within days of a response-time improvement), but NPS and churn effects take 30–90 days to appear in the data. Do not conclude that a response-time change had no retention impact after just two weeks.
Research on CSAT by response-time bands shows the relationship is measurable and consistent. A cohort receiving sub-5-minute replies will show a CSAT distribution skewed toward 4s and 5s; a cohort receiving 24-hour replies will show a distribution skewed toward 2s and 3s. That distributional shift is your signal.
Pro Tip: Build your dashboard with five columns: FRT by channel, TTR, SLA attainment rate, re-contact rate, and CSAT. Those five numbers tell you whether you are fast, complete, and trusted.
A field example: improving responsiveness in a home-services operation
A home-services operation serving residential customers across a metro area faced a common problem: inbound requests were acknowledged inconsistently, with FRT ranging from 8 minutes to over 6 hours depending on time of day and technician availability. Customers were calling back to confirm receipt, which added to queue volume and delayed responses to new requests.
Operational changes implemented:
- Deployed an AI-driven acknowledgment template that confirmed receipt within 2 minutes, provided a reference number, and gave a 2-hour response window for standard requests and a 30-minute window for P1 (safety-critical) requests.
- Introduced a four-tier triage protocol (P1–P4) applied at intake, with P1 and P2 requests routed to a dedicated dispatcher rather than the general queue.
- Revised dispatch scheduling to align technician availability windows with peak inbound volume (weekday mornings and early evenings).
- Added a proactive ETA confirmation message sent 30 minutes before each scheduled arrival.
Outcomes observed:
- Inbound callback volume (customers calling to confirm receipt) dropped substantially after the acknowledgment template was deployed.
- SLA attainment for P1 and P2 requests improved to consistent compliance within the defined windows.
- Customer satisfaction scores on post-service surveys trended upward over the 90-day measurement period.
- Lead conversion on same-day inbound requests increased, consistent with the pattern that rapid response to field-service leads, as shown in [Harvard Business Review research, materially improves conversion rates.
For property owners managing multiple units, this kind of structured acknowledgment and triage process is especially valuable. A landlord with three simultaneous repair requests needs to know each one is in the queue and prioritized correctly, not just that someone will “get back to them.”
Manager’s one-week to three-month implementation checklist
Week 1 quick wins
- Pull your current FRT by channel for the past 30 days. Identify your worst-performing channel.
- Write and deploy a 2-sentence acknowledgment template for each channel (email, phone, chat, SMS).
- Set written SLA targets by channel and priority tier (use the benchmark table above as your starting point).
- Add re-contact rate to your existing reporting dashboard.
- Brief your team on the acknowledgment-first protocol: reply fast to confirm receipt, then take the time to resolve correctly.
30-day implementation items
- Implement a four-tier triage protocol (P1–P4) at intake.
- Create a priority queue for P1 and P2 requests with dedicated routing.
- Begin intraday staffing adjustments based on hourly volume data.
- Run your first CSAT cohort comparison: requests that met FRT SLA vs. those that missed it.
- Evaluate WFM software options if you are managing more than 10 agents or technicians.
60–90 day items
- Pilot an AI acknowledgment tool for first-touch responses on your highest-volume channel.
- Roll out proactive ETA updates for all scheduled service visits.
- Review re-contact rate data and identify the top three issue categories driving callbacks.
- Tighten SLA targets based on 60-day performance data.
- Present a response-time impact report to leadership: FRT trend, CSAT trend, and re-contact rate trend side by side.
Sample SLA targets by priority tier:
These targets align with published SLA benchmark guidance and are a practical starting point for most residential service operations. Adjust P1 and P2 windows tighter if your customer base includes property managers or commercial accounts with contractual expectations.
Why responsiveness is a priority at Mdtechservices
At Mdtechservices, we have built our operations around one principle: a homeowner who contacts us is dealing with a disruption to their daily life, and every minute of delay makes that disruption worse. In Orange County and Los Angeles County, where customers have real choices and high expectations, our reputation depends on how quickly and reliably we respond, not just on the quality of the repair itself.
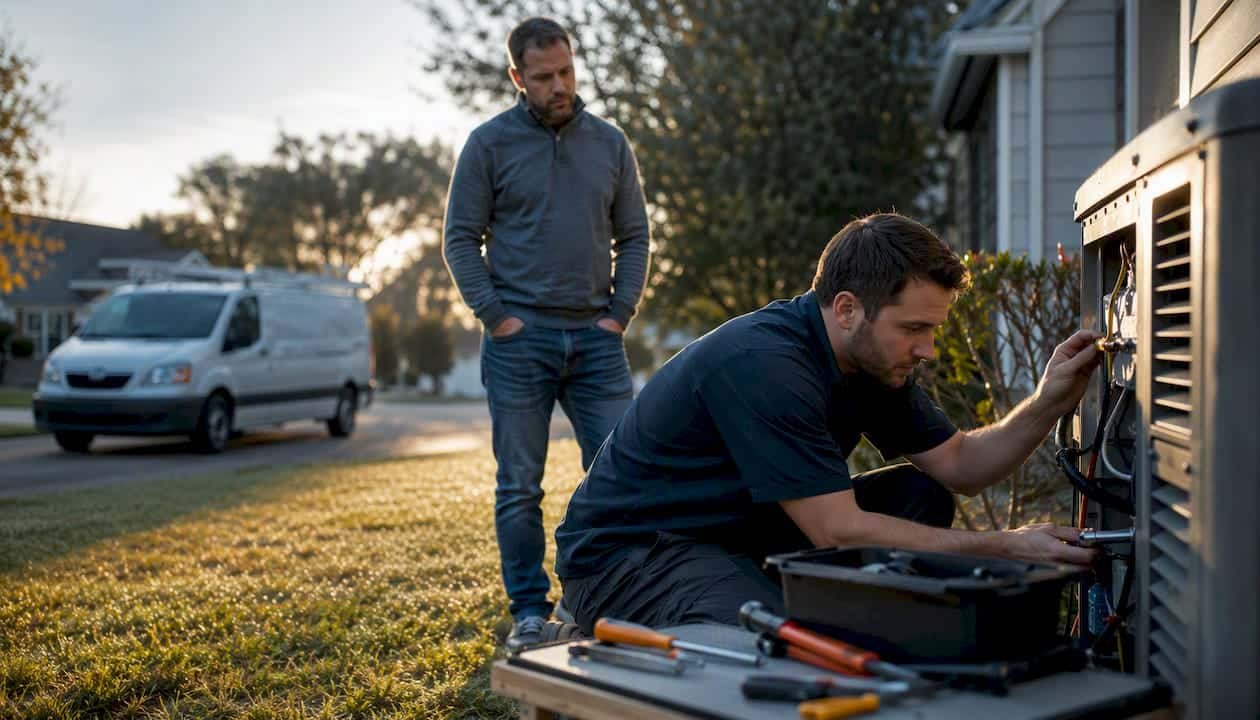
We invest in structured acknowledgment processes, clear ETA communication, and licensed technicians who are dispatched to match inbound demand patterns. For safety-critical requests — gas appliance issues, HVAC failures in summer heat, or urgent plumbing problems — we treat response speed as a safety issue, not just a service metric. A fast, accurate first response protects our customers and protects our standing in the communities we serve.
Mdtechservices delivers the responsive local service your property deserves
When a refrigerator fails or an HVAC system goes down, the difference between a 10-minute acknowledgment and a 6-hour silence is the difference between a loyal customer and a lost one. Mdtechservices provides rapid-dispatch appliance repair and installation across Orange County and Los Angeles County, with licensed technicians, online booking, and a structured response protocol built around the benchmarks in this article.
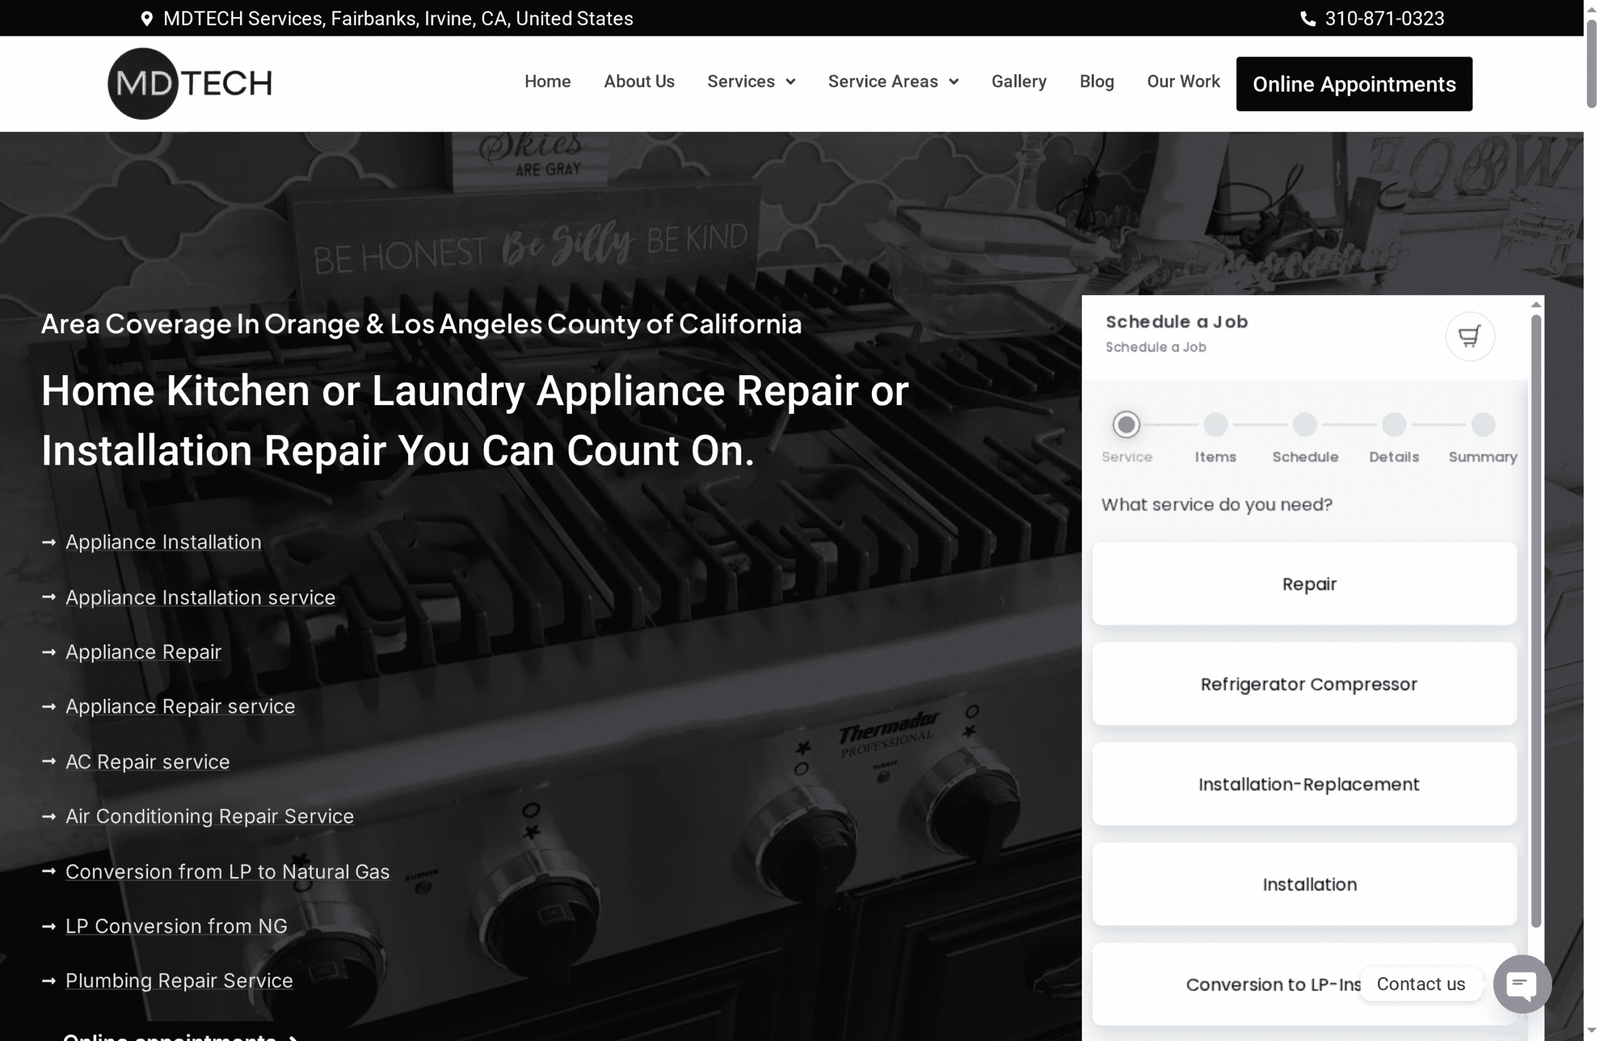
Every service request receives a confirmed acknowledgment, a clear ETA, and a licensed technician matched to the job. For property managers and homeowners who need faster appliance repair with less downtime, Mdtechservices is the local provider built for exactly that. Book your service appointment online today or call us directly to get a same-day response on your request.
Sources
These are the primary references used throughout this article. Each one is worth bookmarking if you are building or refining a response-time program.
- Impact of response time on client satisfaction | timetoreply
- How to measure the dimensions of service quality | SurveyMonkey
- Service quality and customer satisfaction in the post pandemic world
- First Response Time Benchmarks 2026: By Channel and Industry
- First reply time: 9 tips to deliver faster customer service – Zendesk